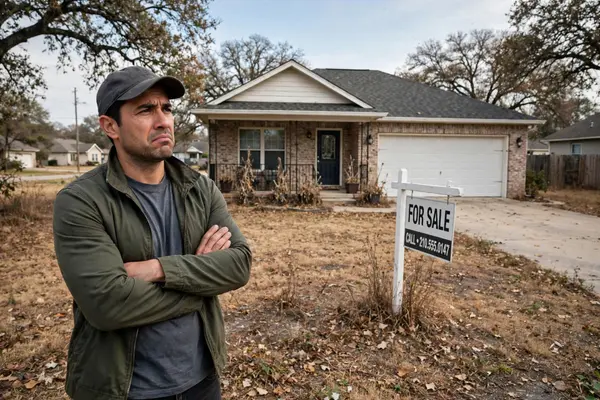
Will San Antonio home prices crash?
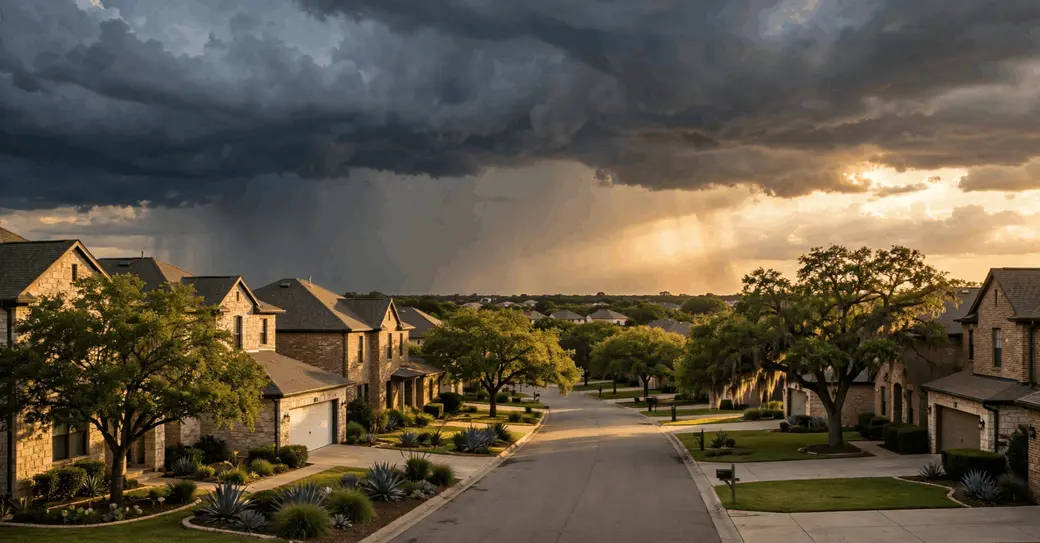
“Are San Antonio home prices going to crash?”
I hear this from sellers every week. Here’s what the actual data says.
Home values are down about 2% from last year. Not 20%. Two.
Sales are still happening. There’s no foreclosure wave. There’s no 2008 setup.
What we have is a slow, boring normalization. Prices drifted down from the 2022 peak, buyers got leverage, sellers have to price honestly. That’s it. That’s the whole story.
A crash needs forced sellers and no buyers. We have neither.
The numbers: down about 2%, not 20%
Let’s start with what the numbers actually say, because the gap between the fear and the figures is the whole story.
Zillow’s October data puts the San Antonio typical home value at $272,421, down 0.7% for the month and 2.0% for the year. That is down from $273,869 in September. Inventory is up 2.6% year over year and sales are down 7.3%.
Redfin had San Antonio’s median sale at $298,948 in October, down 0.3% year over year. Sales fell 13.3% while new listings dropped 17.6%, the biggest decline of any major metro. Pending sales were down 9.5% year over year and active listings were down 3.2%.
Realtor.com shows the city median sold at $282,971 in October, down 2.23% year over year, with homes taking 67 days to sell and closing at 99% of list. The city median listing was $289,450, down 2.27% year over year.
SABOR’s September numbers (still the latest, the October report is not out yet) had 2,793 closed sales, a median of $302,999 down about 2% year over year, 88 days on market, 92.4% of original list, and 5.95 months of inventory.
Every measure says the same thing: down about 2%, not 20%. A drift, not a drop.
The national picture: the first annual decline since May 2023
Nationally, home-sale prices fell 0.4% year over year in October, the first annual decline since May 2023. The U.S. median sale price was $388,634. Pending sales were the lowest since 2013, excluding April 2020. 61% of homes sold below asking, and 36% of sold homes had a price drop, a record high.
So yes, the national market is soft too. But soft is not crashing. A 0.4% national decline is a market catching its breath after a run-up, not a market falling apart.
Why this is not 2008
The 2008 crash had a specific setup: loose lending, adjustable-rate mortgages resetting, and then a wave of forced sellers who could not pay. None of that is here.
ATTOM’s Q3 report counted 259,666 properties in foreclosure nationally out of 104.6 million homes, about 0.25%. There is no foreclosure wave here. The “zombie” foreclosures, vacant homes stuck in the foreclosure process, numbered 8,482, just 3.3% of foreclosures, down from 3.4%.
Rates are easing, too. Freddie Mac’s 30-year rate was 7.18% for the week ending November 5, down three weeks in a row from 7.40% on October 15. The 15-year was 6.57%.
No wave of forced sellers. No lending blowup. Rates moving in the right direction. That is not a crash setup.
What normalization actually looks like
So what does this market actually feel like for a seller? Slower days on market, more inventory, buyers negotiating. SABOR’s September data had homes averaging 88 days on market and selling at 92.4% of original list. Realtor.com’s October city data had 67 days and 99% of list.
That is a market where buyers have time and leverage, and sellers who price honestly still sell. It is a market where the 2021 playbook, list high and wait, does not work anymore. It is not a market where values fall off a cliff.
The cost of waiting on a crash
If you’re waiting to sell because you think prices will fall off a cliff, that cliff is not in the data. And waiting has a real cost: carrying costs on a house you want to leave, months of your life on hold, and prices drifting slowly, not falling.
If you’re waiting to BUY for the same reason, same answer. Make your move based on your life, not on fear of a crash that is not coming.
The bottom line
This is not a crash. It is a slow, boring normalization. Prices drifted down, buyers got time, sellers have to price honestly. Homes still sold.
Want the honest numbers for your home, not the metro average? Get a home value based on real comps near you, then call or text me at (210) 331-3870 and we will talk through what the range means for your plans.
Sources
- Zillow Market Report, San Antonio, October 2026, released November 5, 2026 (typical home value $272,421, down 0.7% month over month and 2.0% year over year; inventory up 2.6% year over year; sales count nowcast down 7.3% year over year)
- Redfin housing market data, October 2026, published November 10, 2026 (San Antonio median sale price $298,948, down 0.3% year over year; sales down 13.3%; new listings down 17.6%; U.S. median sale price $388,634, down 0.4% year over year)
- Realtor.com monthly market data, San Antonio, October 2026 (city median sold $282,971, down 2.23% year over year; 67 days median time on market; 99% sale-to-list; median listing $289,450, down 2.27% year over year)
- San Antonio Board of REALTORS (SABOR), September 2026 report, released October 9, 2026 (2,793 closed sales; median $302,999, down about 2% year over year; 88 days average on market; 92.4% of original list; 5.95 months inventory)
- Freddie Mac Primary Mortgage Market Survey, 30-year fixed at 7.18%, week ending November 5, 2026 (third straight weekly decline from 7.40% on October 15; 15-year fixed 6.57%)
- ATTOM Q3 2026 Vacant Property and Zombie Foreclosure Report, August 28, 2026 (259,666 U.S. properties in the foreclosure process out of 104.6 million residential properties, about 0.25%)
Categories
Recent Posts